
2016-2017 Winter Forecast
Winter is just about to arrive in the northeast and the weather community is buzzing with winter forecasts, wish-casts, and questions without answers. When creating a winter forecast, most meteorologists and weathermen use sea surface temperature (SST) analogs. They find the years in the past that had ocean temperatures similar to what they are currently, and they use those years to create forecasts. Sometimes, however, good matches are challenging to find. One way to overcome this is to find an anti-log, or a year that has the opposite features. Here is an example:

The Process
Creating a winter forecast is mostly composed of sifting through government databases for maps, observing the changes in patterns, and finding patterns in seemingly meaningless sets of numbers. At times it can be boring and frustrating because we weather geeks often find our search to be inconclusive. It takes a lot of boring--and interesting--work to come up with what we all want to know: how much snow?
It all begins with analogs. What better way to predict the future than looking to the past? Weather is cyclic, so it is easy to find general similarities in weather patterns. While it can never be exact, the idea of analog forecasting is to find years whose patterns are similar to this year's and use them to predict what will happen next. There is a truly countless number of factors that go into the weather--which is why it can never be predicted perfectly--and it is our job as weathermen to analyze and synthesize all the factors and spit something out in English. Some of the main factors we look at are the ENSO (El Niño Southern Oscillation), the PDO (Pacific Decadal Oscillation), the AMO (Atlantic Multidecadal Oscillation), and solar activity. As winter approaches, the PNA (Pacific North American Pattern), NAO (North Atlantic Oscillation), AO (Arctic Oscillation), and others will also have influence.
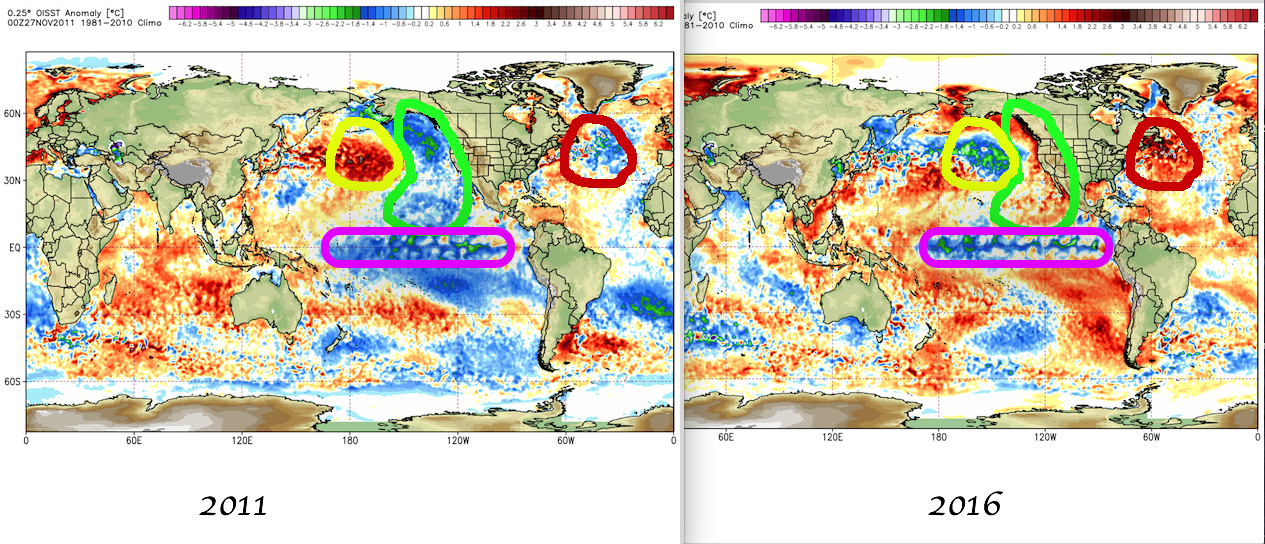
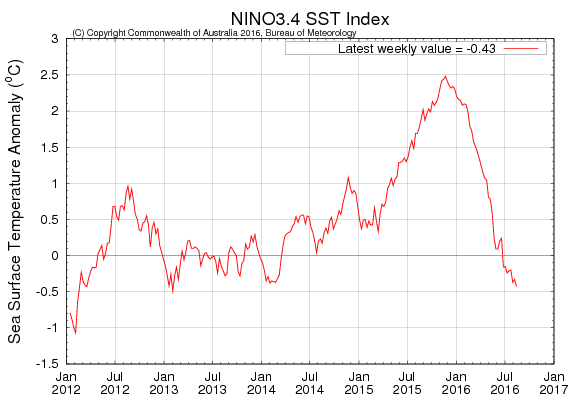
This year, the ENSO is transitioning from a strong El Niño to a weak La Niña. Each state is described below.
The El Niño-Southern Oscillation (ENSO) is a naturally occurring phenomenon that involves fluctuating ocean temperatures in the equatorial Pacific. The warmer waters essentially slosh, or oscillate, back and forth across the Pacific, much like water in a bath tub. For North America and much of the globe, the phenomenon is known as a dominant force causing variations in regional climate patterns. The pattern generally fluctuates between two states: warmer than normal central and eastern equatorial Pacific SSTs (El Niño) and cooler than normal central and eastern equatorial Pacific SSTs (La Niña). Often, sea surface temperatures (SSTs) are used to identify this oscillation, but it is important to understand that changes in sub-surface ocean temperatures are the first to respond to an oncoming change in the ENSO phase. For instance, when ENSO is transitioning into a warm phase the sub-surface temperatures begin to warm above average, while a shallow layer of near average temperature remains at the surface. Eventually, the surface ocean temperatures will respond to the warming of the sub-surface temperatures, and a warm phase of the ENSO cycle ensues. The same cycle occurs, only opposite, for the cool phase of ENSO. (Courtesy of the State Climate Office of North Carolina)
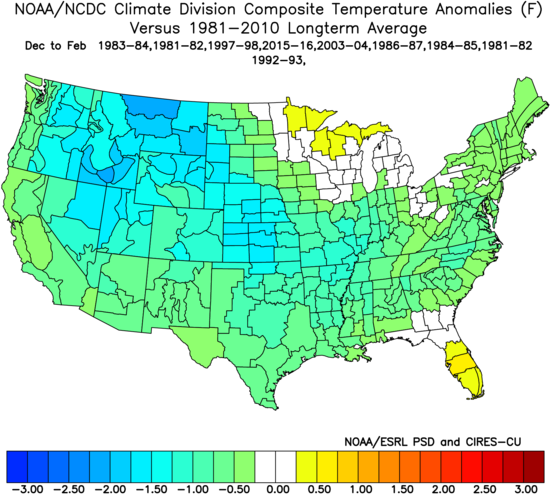
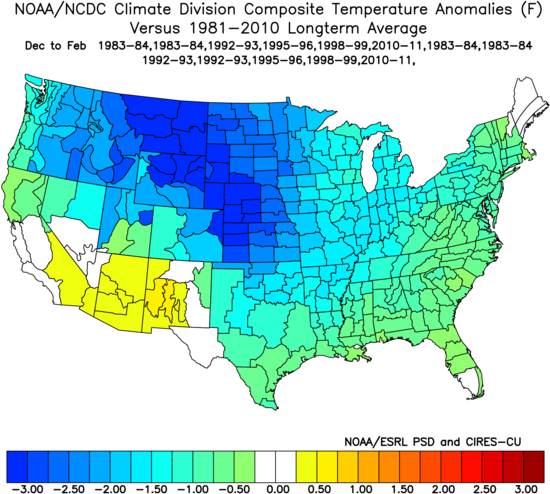
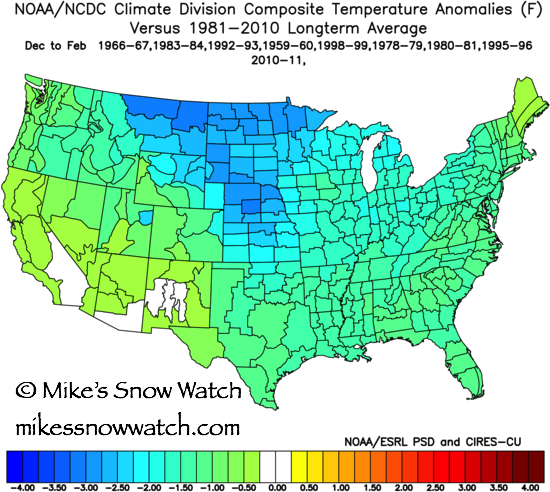
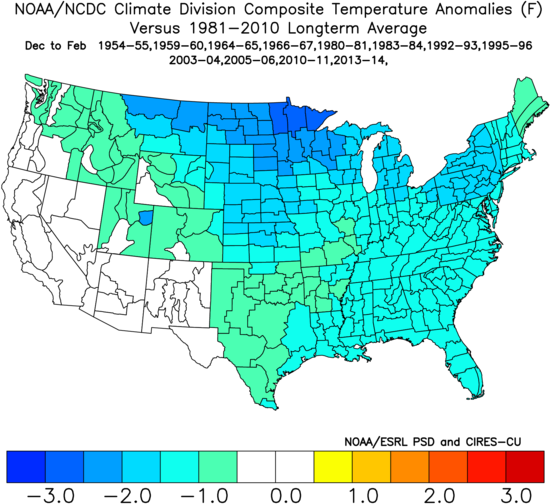
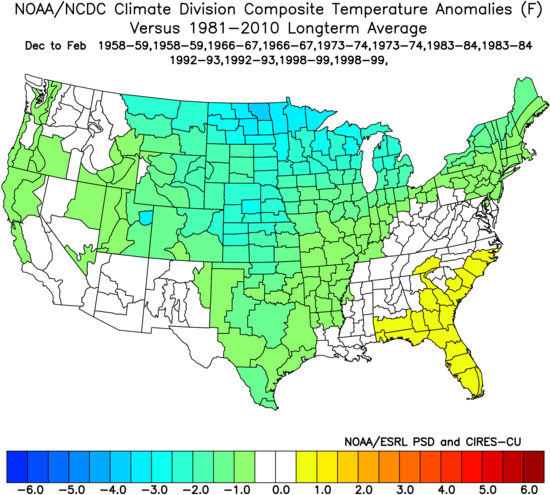
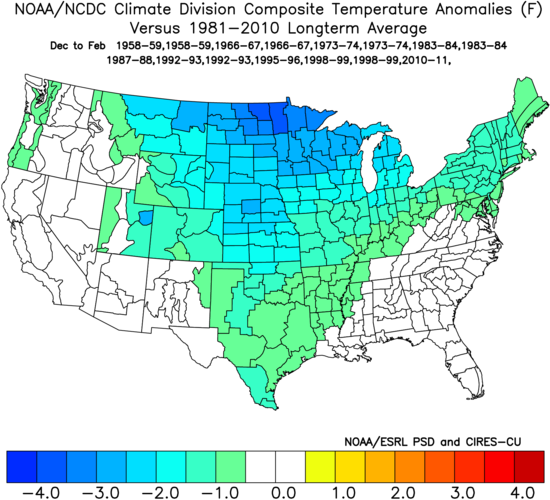
Other years that had ENSO fluctuations like this year include 1958, 1966, 1973, 1983, 1987, 1992, 1995, 1998, and 2010. NOAA has a tool that considers each of these years equally and creates a map indicating how cold all of these winters look put together. As shown below, these years had cold winters overall, especially in the northern and central parts of the country.
It all begins with analogs. What better way to predict the future than looking to the past? Weather is cyclic, so it is easy to find general similarities in weather patterns. While it can never be exact, the idea of analog forecasting is to find years whose patterns are similar to this year's and use them to predict what will happen next. There is a truly countless number of factors that go into the weather--which is why it can never be predicted perfectly--and it is our job as weathermen to analyze and synthesize all the factors and spit something out in English. Some of the main factors we look at are the ENSO (El Niño Southern Oscillation), the PDO (Pacific Decadal Oscillation), the AMO (Atlantic Multidecadal Oscillation), and solar activity. As winter approaches, the PNA (Pacific North American Pattern), NAO (North Atlantic Oscillation), AO (Arctic Oscillation), and others will also have influence.
This year, the ENSO is transitioning from a strong El Niño to a weak La Niña. Each state is described below.
The El Niño-Southern Oscillation (ENSO) is a naturally occurring phenomenon that involves fluctuating ocean temperatures in the equatorial Pacific. The warmer waters essentially slosh, or oscillate, back and forth across the Pacific, much like water in a bath tub. For North America and much of the globe, the phenomenon is known as a dominant force causing variations in regional climate patterns. The pattern generally fluctuates between two states: warmer than normal central and eastern equatorial Pacific SSTs (El Niño) and cooler than normal central and eastern equatorial Pacific SSTs (La Niña). Often, sea surface temperatures (SSTs) are used to identify this oscillation, but it is important to understand that changes in sub-surface ocean temperatures are the first to respond to an oncoming change in the ENSO phase. For instance, when ENSO is transitioning into a warm phase the sub-surface temperatures begin to warm above average, while a shallow layer of near average temperature remains at the surface. Eventually, the surface ocean temperatures will respond to the warming of the sub-surface temperatures, and a warm phase of the ENSO cycle ensues. The same cycle occurs, only opposite, for the cool phase of ENSO. (Courtesy of the State Climate Office of North Carolina)
Other years that had ENSO fluctuations like this year include 1958, 1966, 1973, 1983, 1987, 1992, 1995, 1998, and 2010. NOAA has a tool that considers each of these years equally and creates a map indicating how cold all of these winters look put together. As shown below, these years had cold winters overall, especially in the northern and central parts of the country.

The same analysis is done with the PDO and the AMO, whose analogs are shown below (PDO on left, AMO on right).
|

|
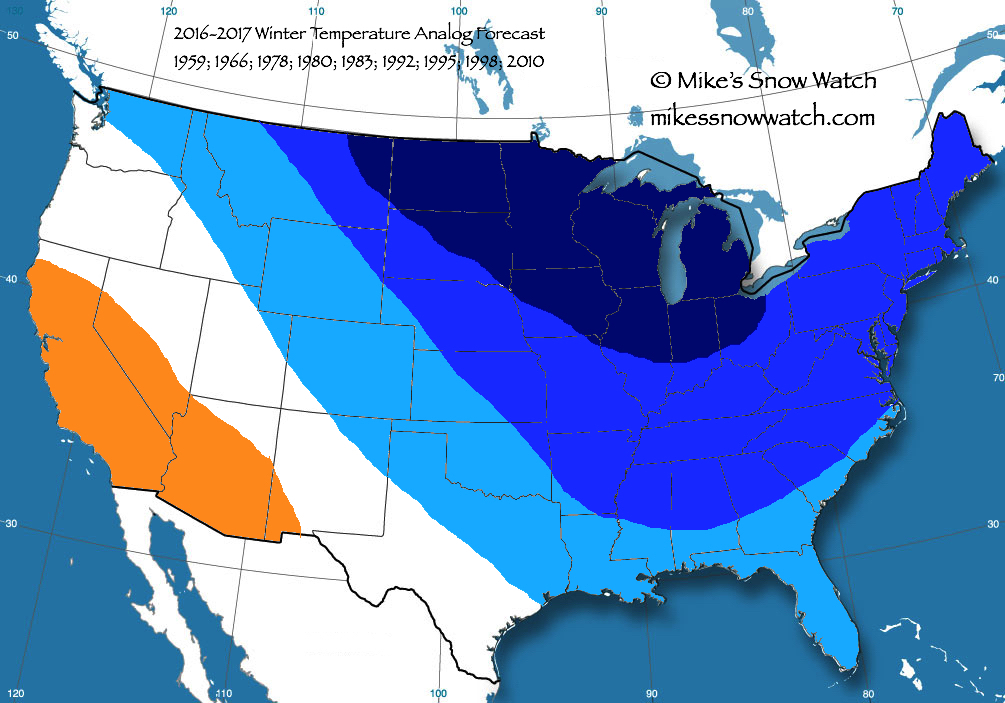
Then, all of these maps are synthesized, once again using NOAA's tool. Other factors are considered, such as solar activity, and then the years are weighed based on their relevance to create a final analog map (below)
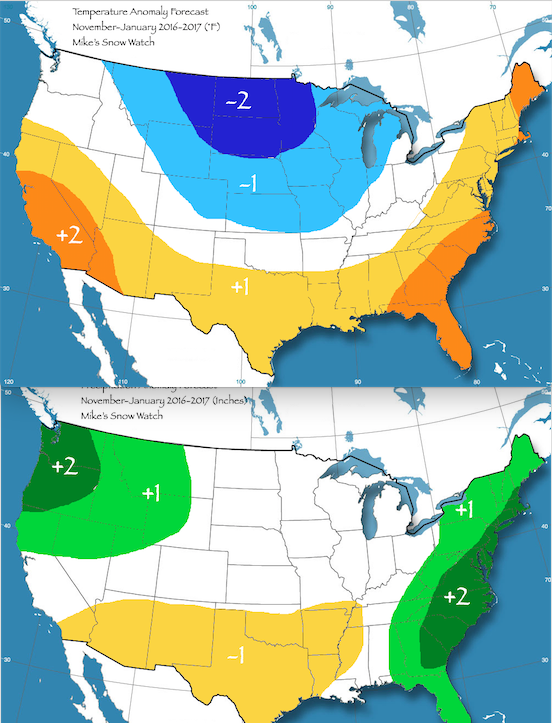
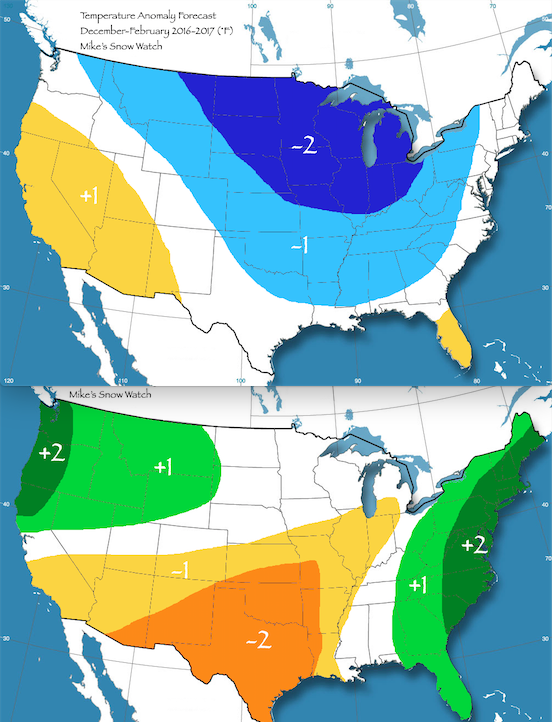
Temperature
|
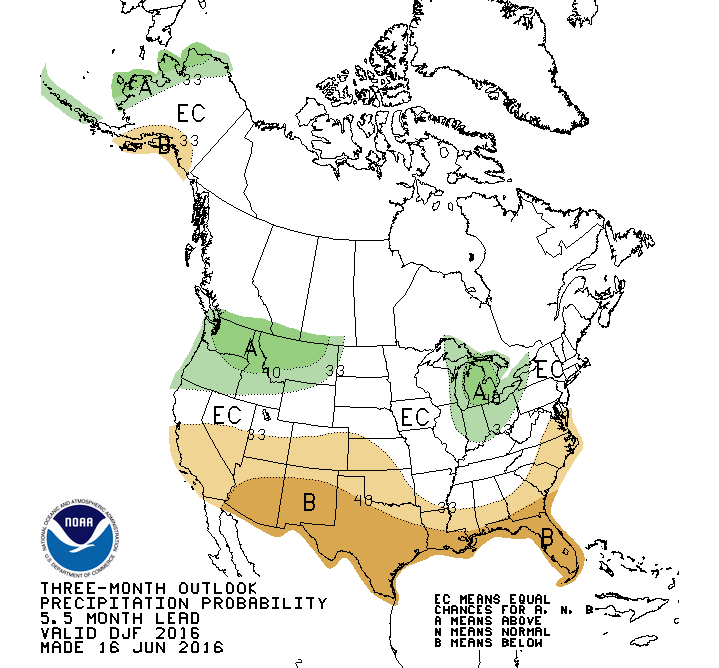
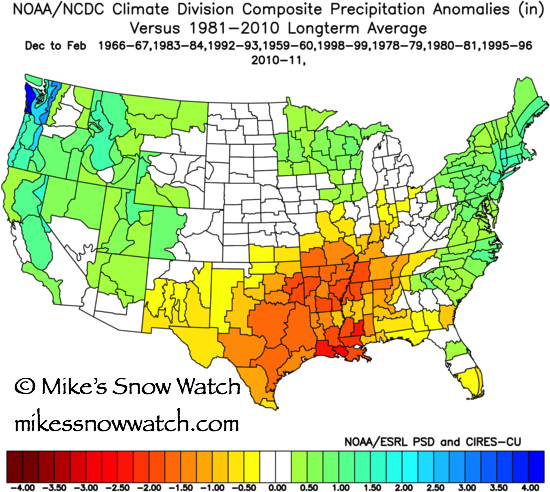
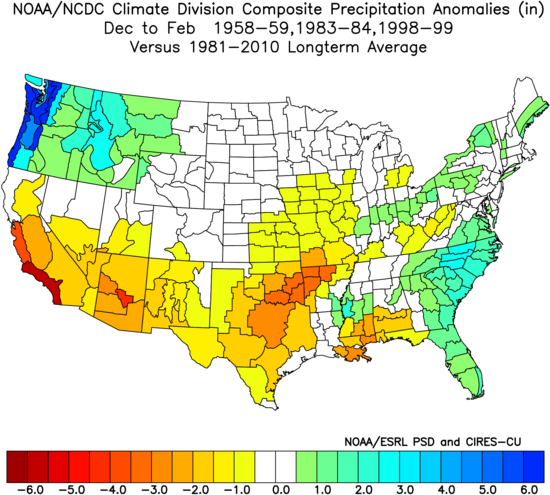
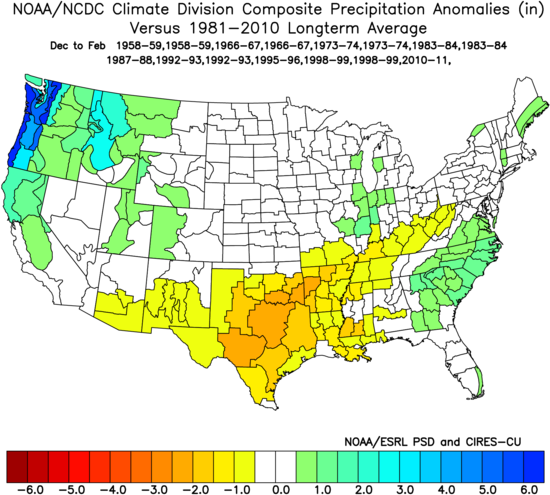
Precipitation
|
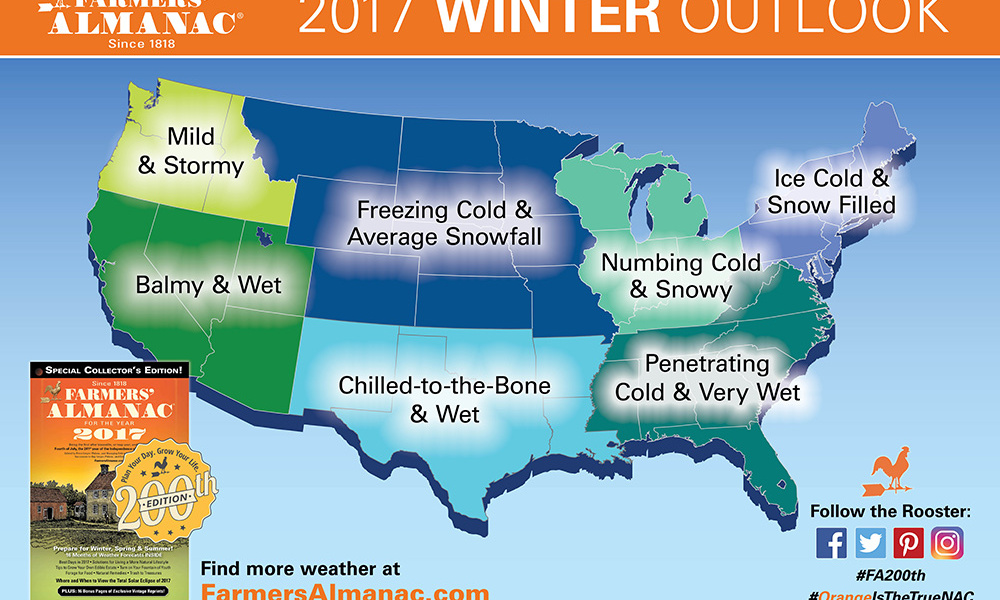
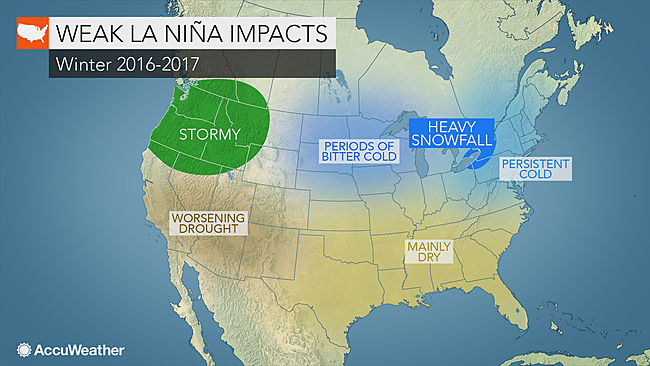
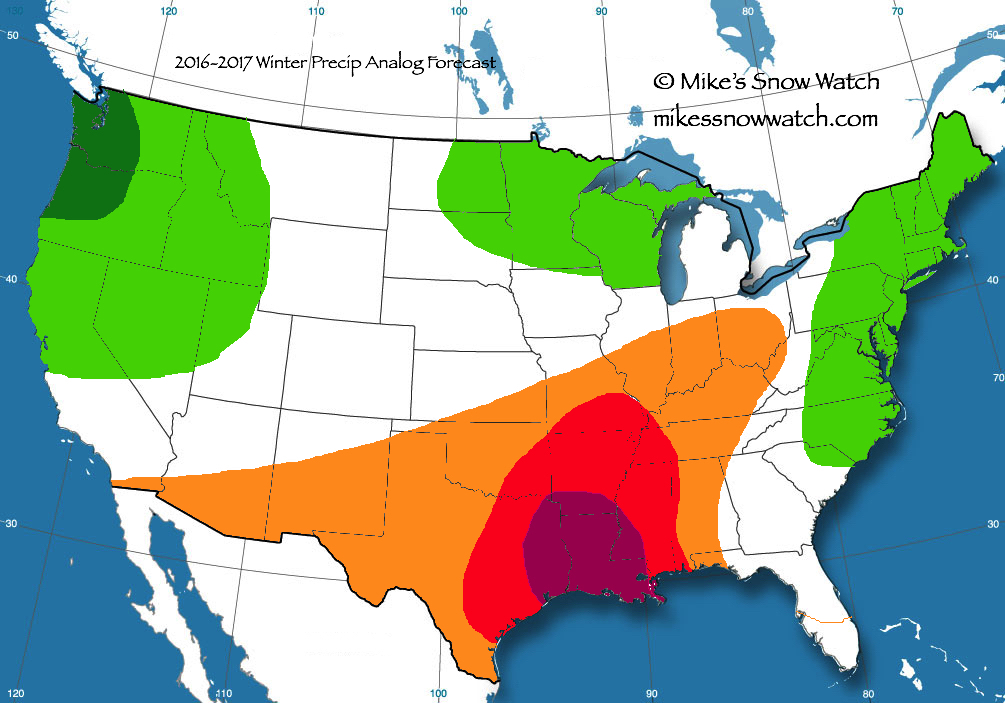
Finally, if you thought we'd never make it, here is the 2016-2017 winter forecast!
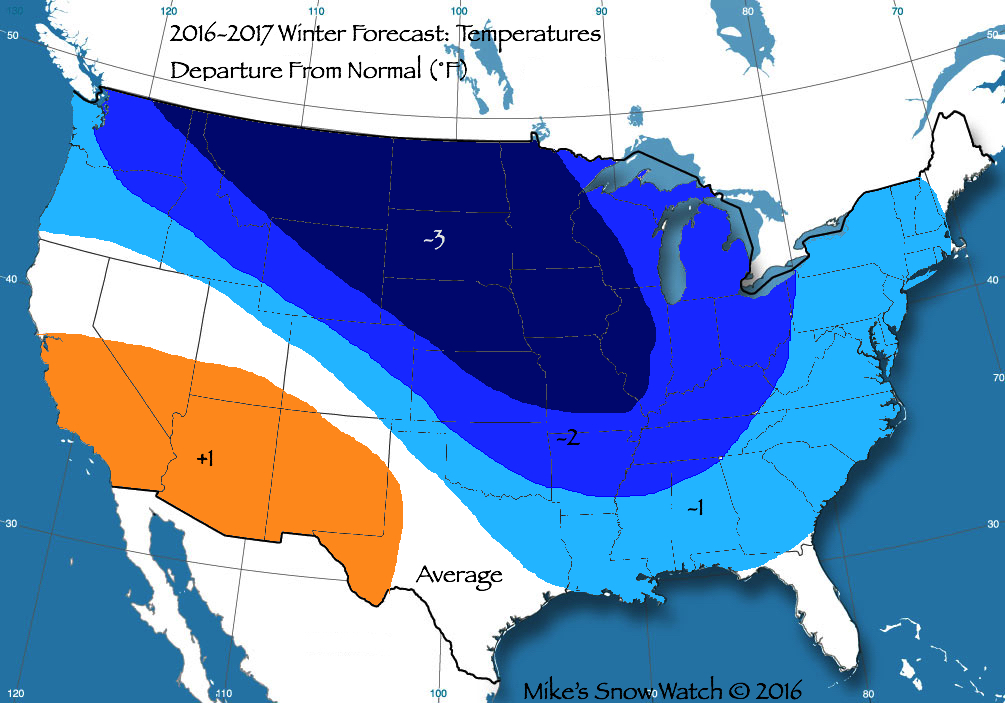
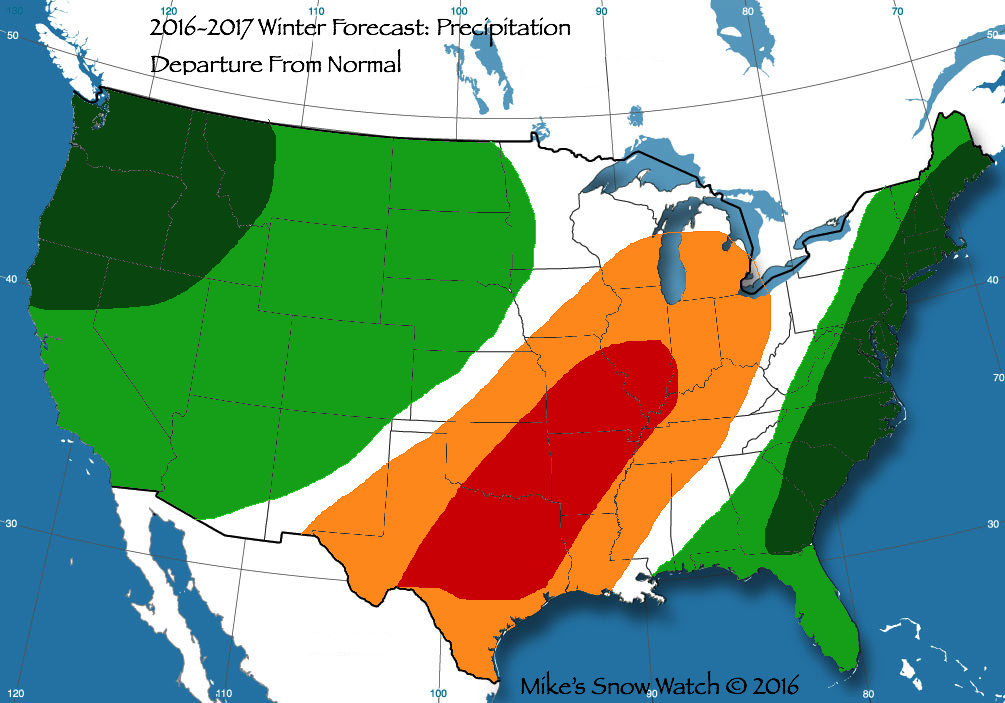
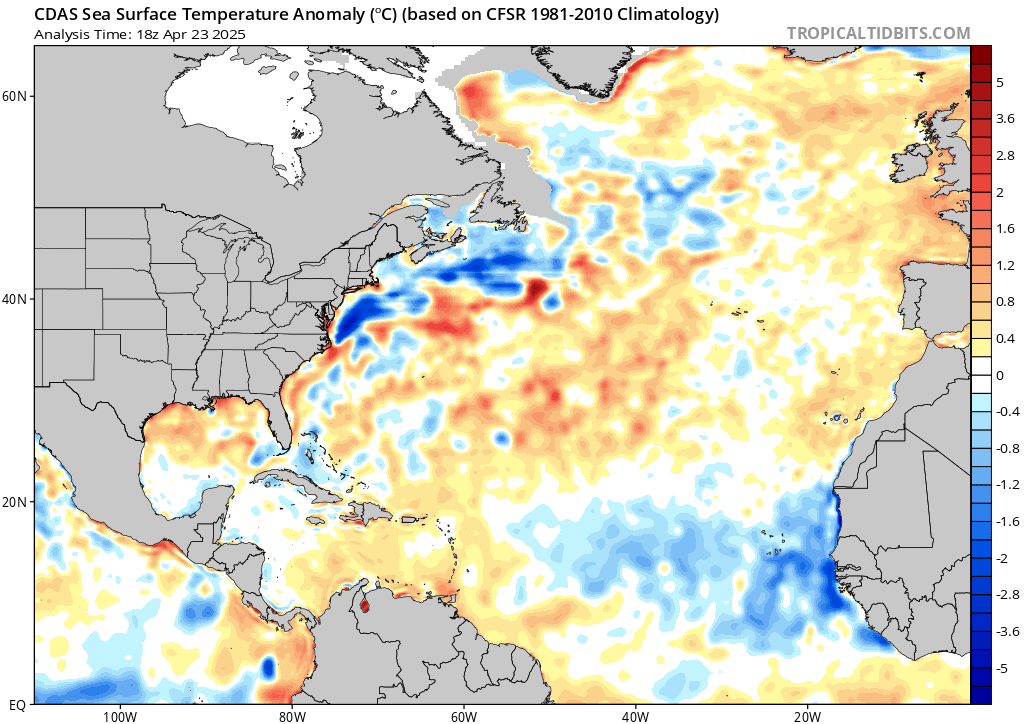
This year, as shown by the maps, is expected to be chilly and wet in our area, usually making for an above average snowfall season. However, the water along the east coast is significantly above average, which could cause storms in the early winter to be warm. These storms would contain a mixture of all types of precipitation, including snow and rain. By midwinter, however, storms should have plenty of moisture from the Atlantic but also plenty of cold air. Therefore, Mike's Snow Watch is expecting a chilly and snowy winter with a late start. Below are some of our competitors forecasts.
|
|
|

|
Both AccuWeather and the Farmer's Almanac are predicting colder winters than Mike's Snow Watch, while the NOAA is predicting a significantly warmer and drier winter, as is typical with their forecasts.
Other Relevant Information to the Winter Forecast
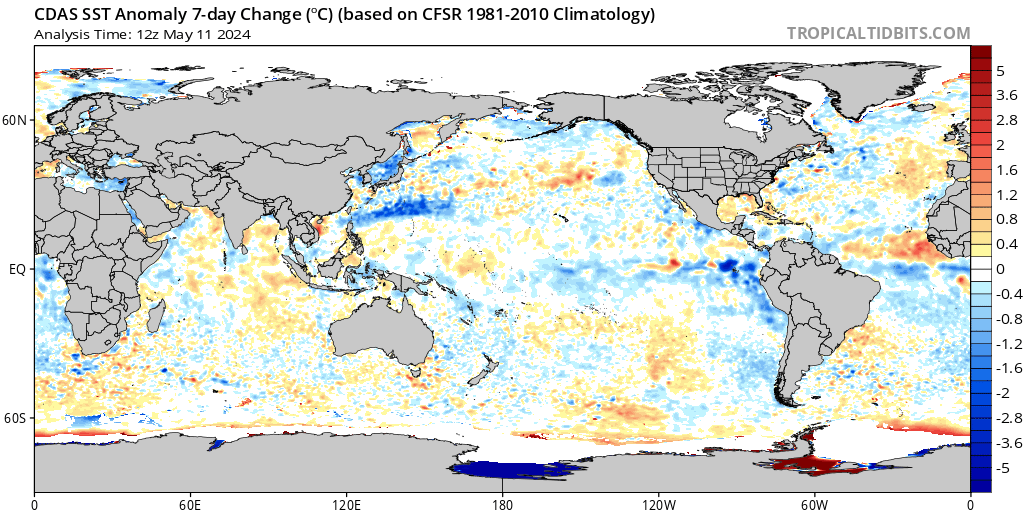
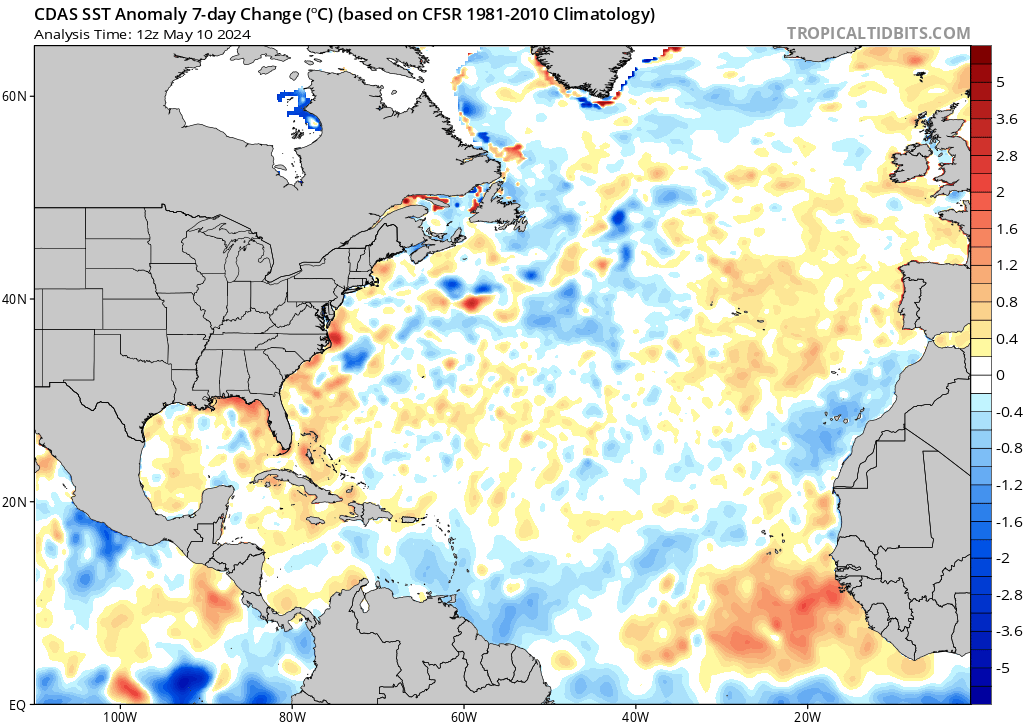
Ocean Analysis


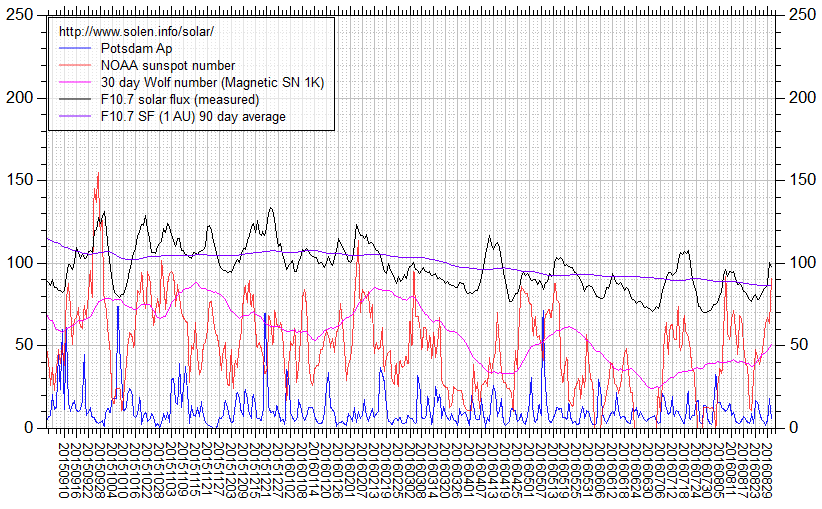
Solar Analysis
Old Information Below
Analog forecasting is a complex way of making a forecast, requiring the forecaster to remember a previous weather event that occurred in a pattern similar to the current one. Then the forecaster uses that historical information to predict what will occur in the future because when the pattern setup is very similar, the outcome is also similar. This type of forecasting is also know as pattern recognition.
Older Maps Below


Analog Group I
Analog Group II - Strong Connection
Analog Group II - Strong & Medium Connection
Analog Group II - Strong, Medium, and Weak Connection
Analog Group II - Strong Connection
Analog Group II - Strong & Medium Connection

Analog Group II - Strong, Medium, and Weak Connection
These maps were created using the NOAA's Earth System Research Laboratory at the following link.
http://www.esrl.noaa.gov/psd/data/usclimdivs/
http://www.esrl.noaa.gov/psd/data/usclimdivs/
| 2016-2017_enso_analysis.xlsx |
