2018-2019 Winter Forecast
Notes: This forecast is preliminary. All analog graphs are created by Mike's Snow Watch using NOAA's ESRL PSD climate reanalysis program. All forecast graphics are created by Mike's Snow Watch. No graphs may be shared without giving credit to the appropriate sources.
Summary
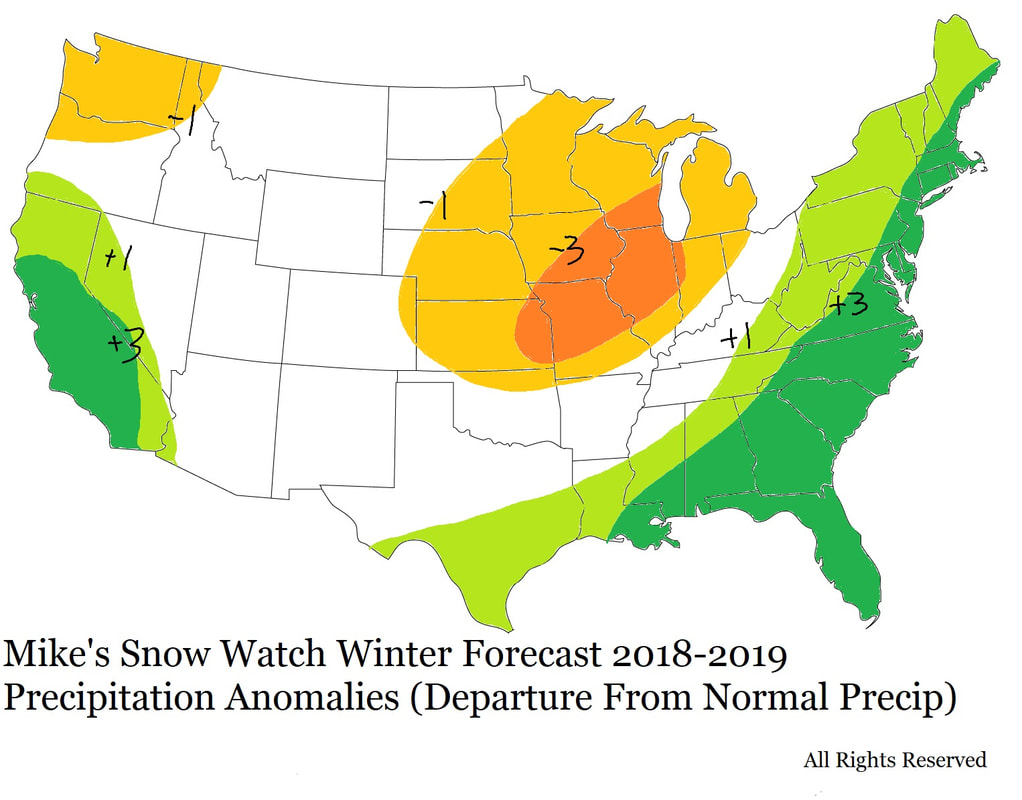
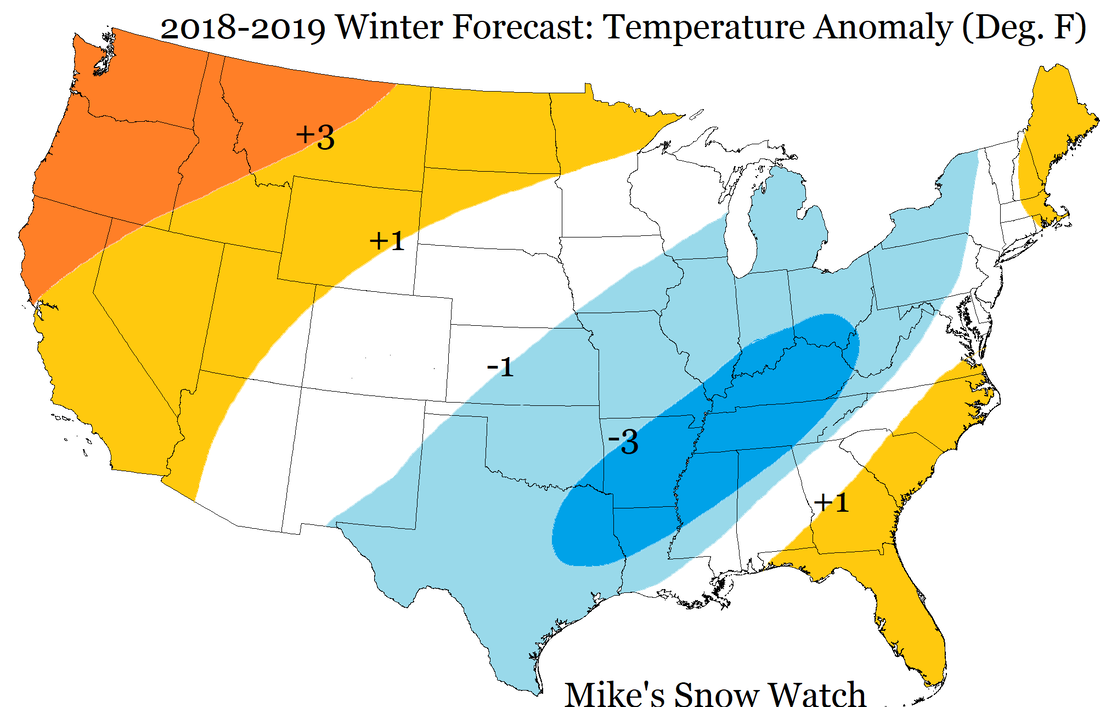
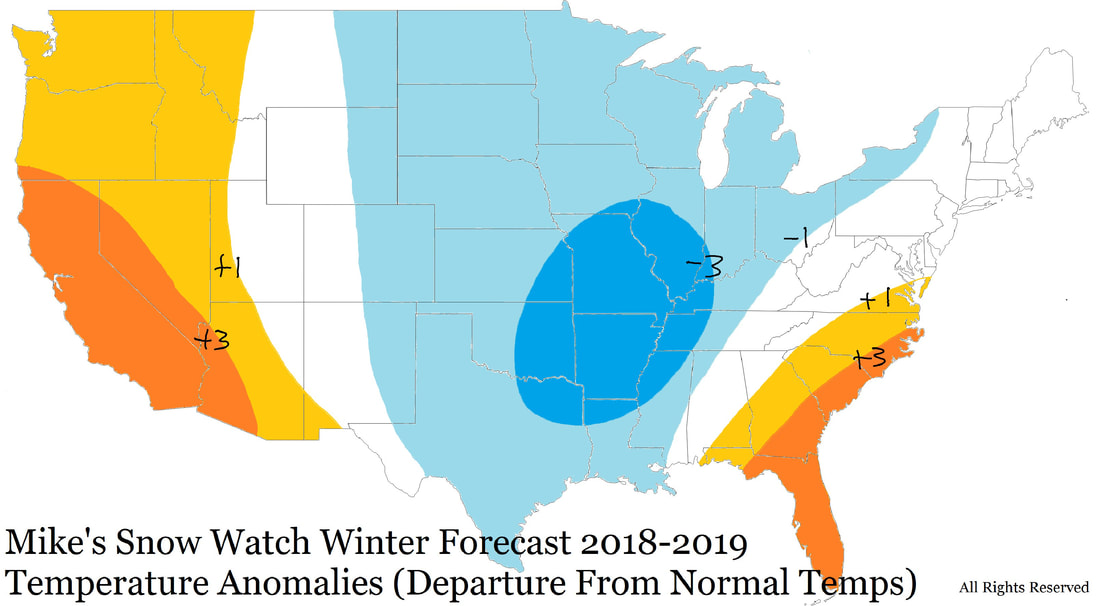
This winter will feature a weak El Nino, meaning ocean water in the eastern central Pacific will be warmer than normal, which has a major impact on global weather. For the United States, the El Nino combined with other factors results in a temperature pattern that focuses the warmth in the western part of the country and the center of the cold in the eastern part of the country. Warm coastal Atlantic ocean temperatures are likely to keep the east coast from having a brutally cold winter. This temperature pattern paired with El Nino conditions and warm Atlantic ocean temperatures will result in above average precipitation for most of the southern and eastern parts of the country. The midwest and pacific northwest area will have less precipitation than usual.
In-Depth Analysis
Methodology: This forecast was developed mainly by the method of analog forecasting, which uses historical records to predict future weather events. Analog forecasting first requires analogs, so the large scale weather patterns that are currently going on need to be considered, and then past years like the current setup are blended and weighted to determine what is likely to happen next. In the winter forecast, analogs were determined based mainly on these factors:
- Niño 3.4 Index
- Pacific Decadal Oscillation
- Atlantic Multidecadal Oscillation
- Southern Oscillation Index
- Current Ocean Sea Surface Temperatures
Niño 3.4 Analogs:
- Less Weighted: 1899, 1918, 1925
- More Weighted: 1904, 1923, 1929, 1951, 1968, 1986
- Anti-logs: 1906, 1959, 1966, 1970, 1983, 2005
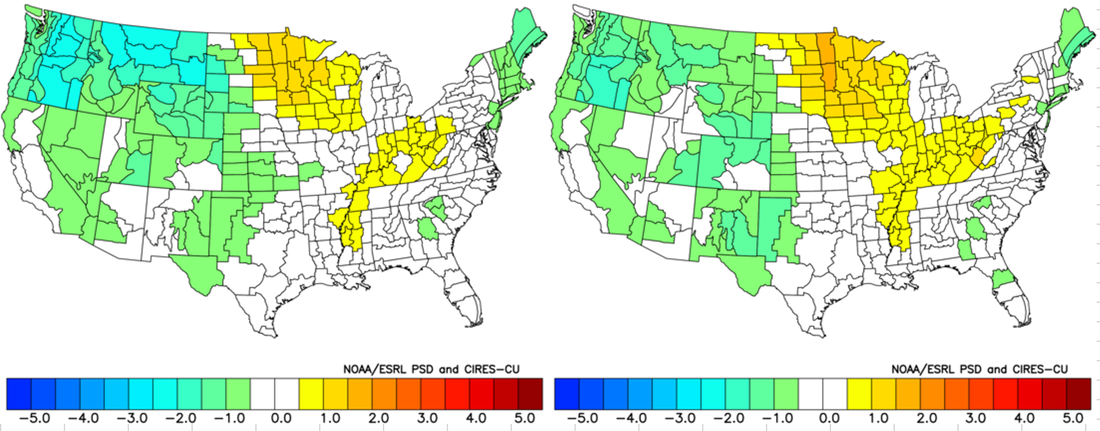
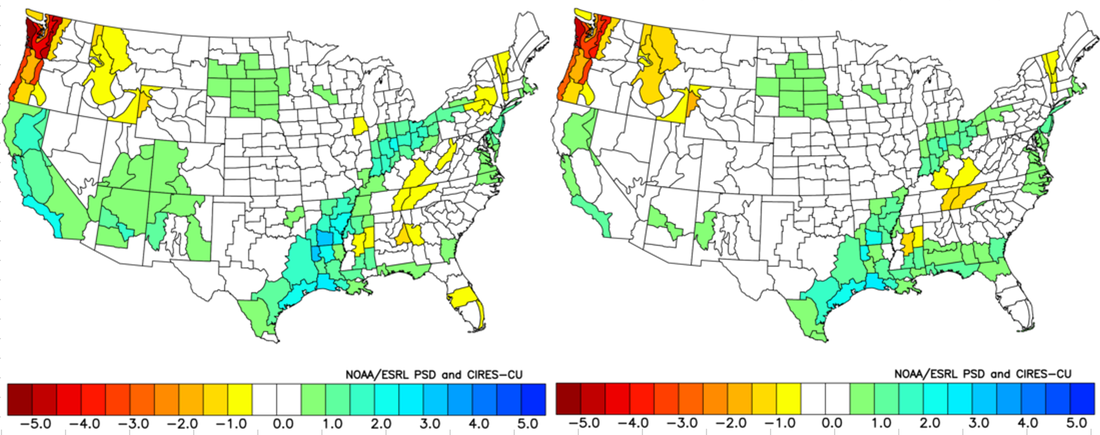
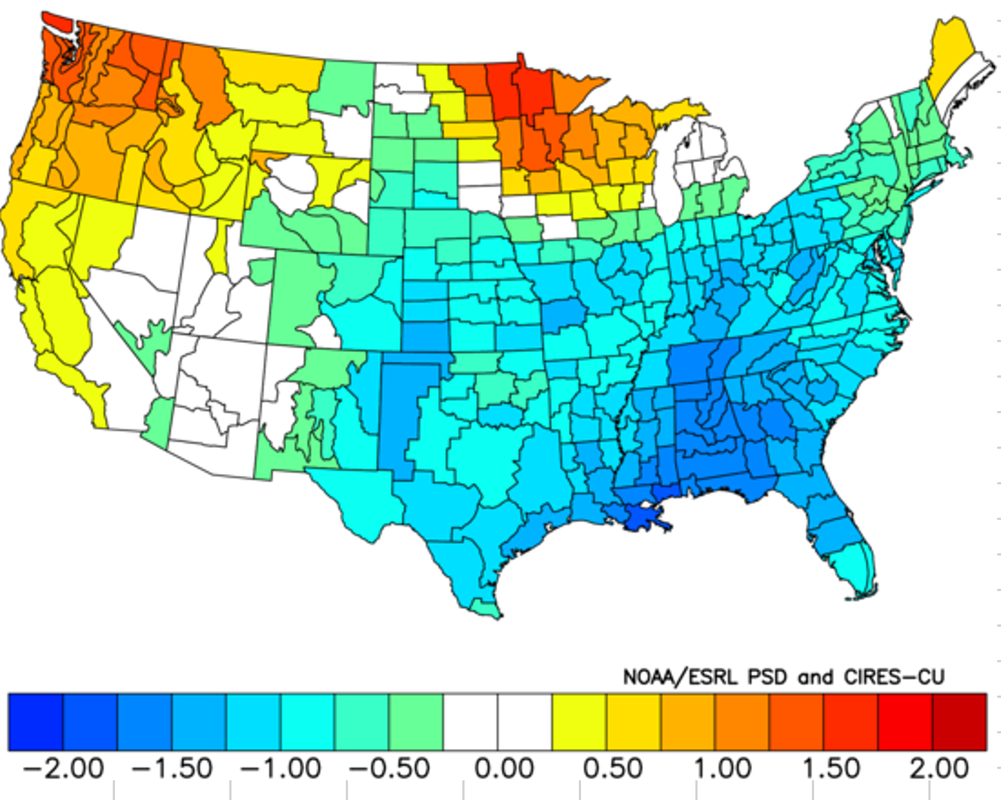
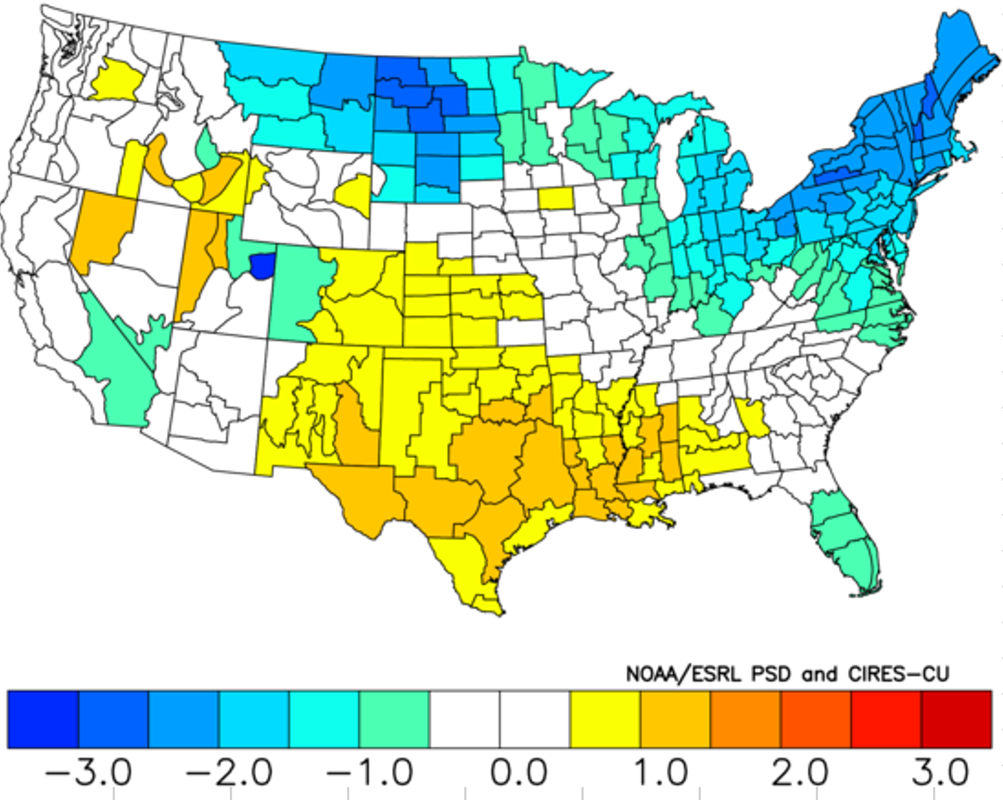
Temperature Anomalies from More Weighted Niño 3.4 Analogs and All Niño 3.4 Analogs
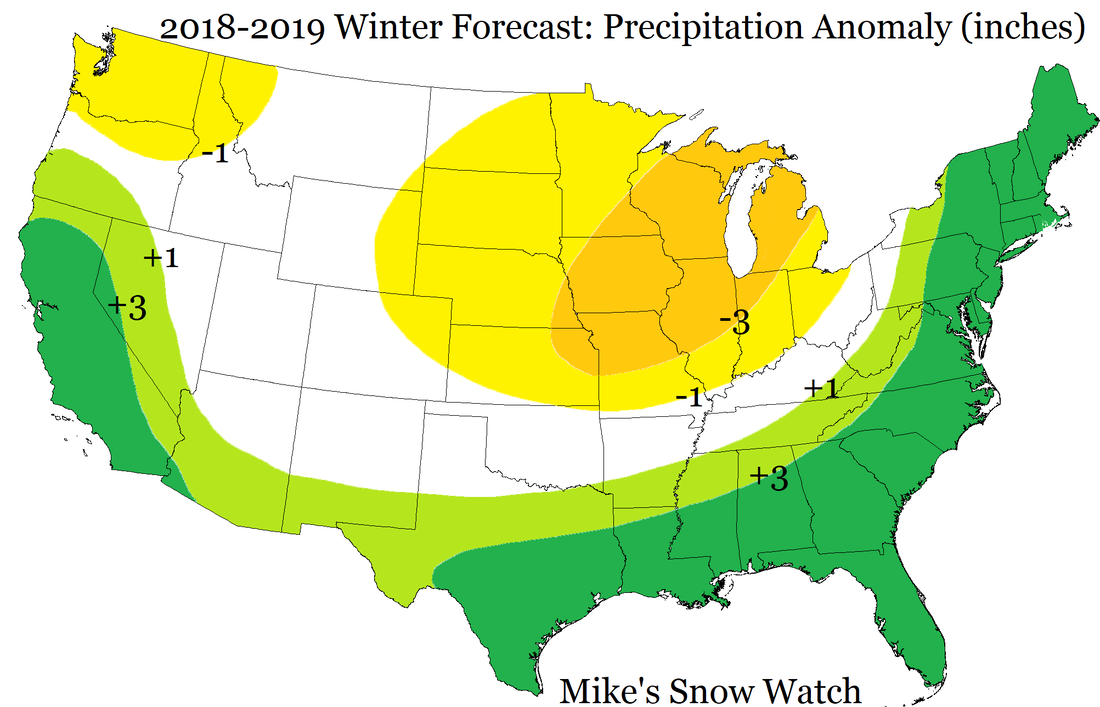
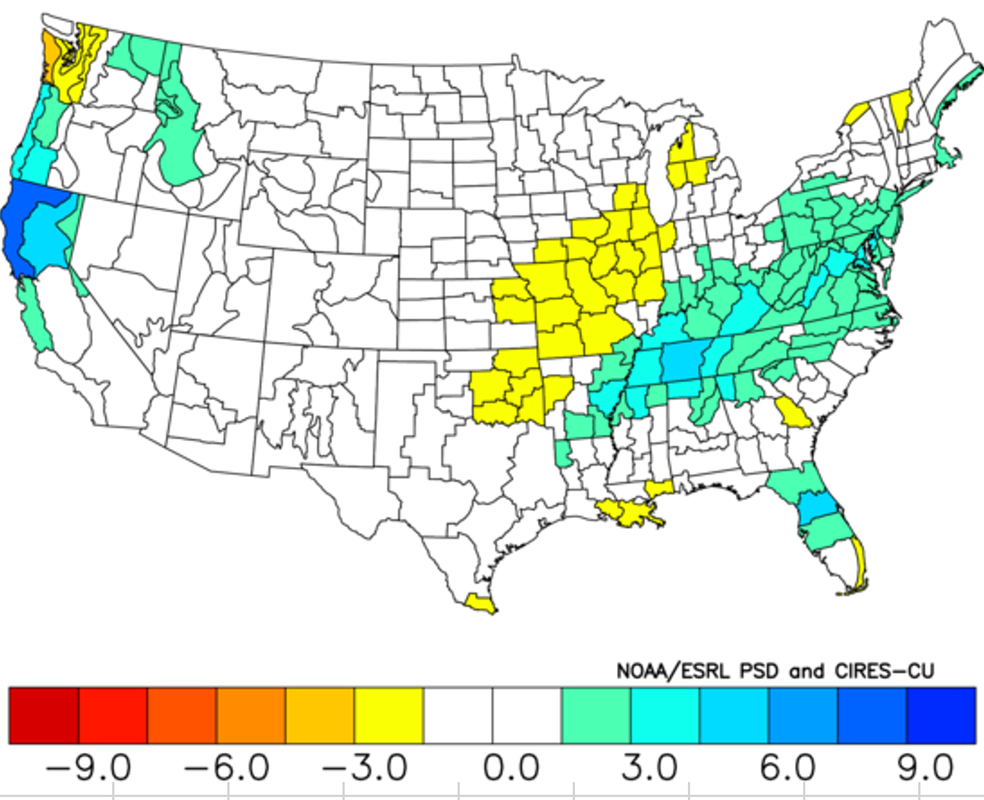
Precipitation Anomalies from More Weighted Niño 3.4 Analogs and All Niño 3.4 Analogs
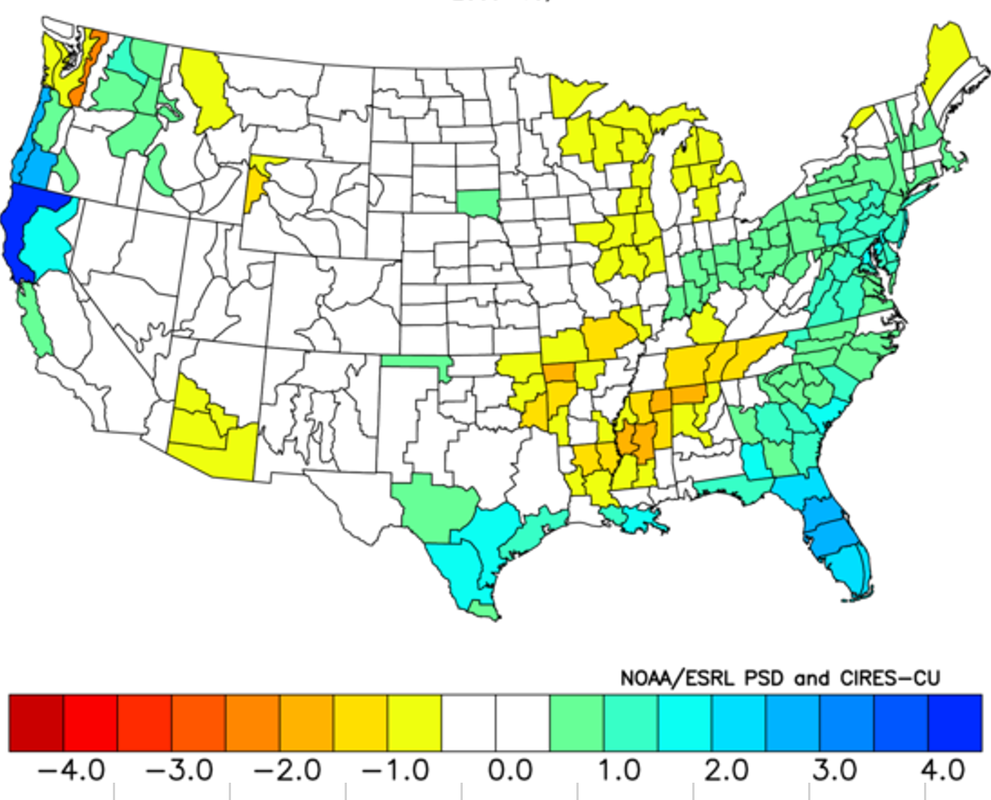
Temperature Anomalies from More Weighted Niño 3.4 Anti-logs and All Niño 3.4 Anti-logs (Color-adjusted)
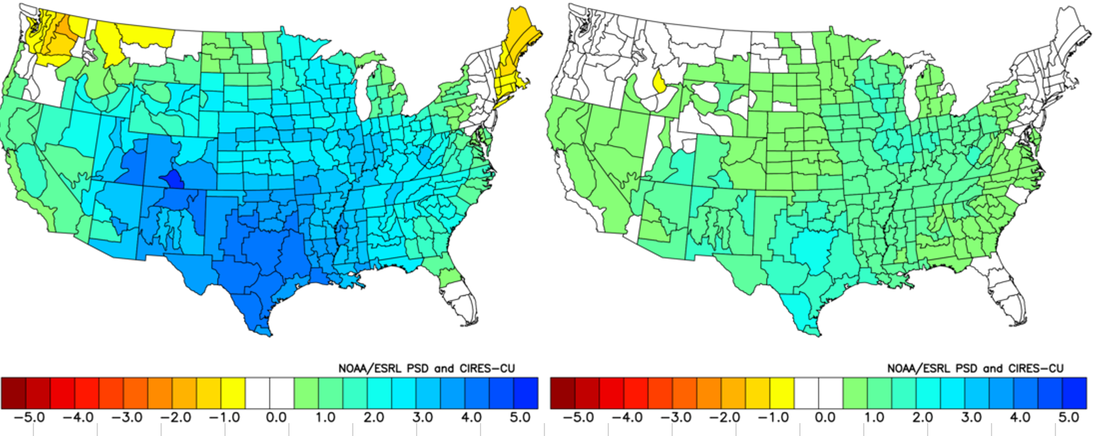
Precipitation Anomalies from More Weighted Niño 3.4 Anti-logs and All Niño 3.4 Anti-logs (Color-adjusted)
PDO Index Analogs
- More Weighted: 1903, 1907, 1910, 1914, 1933, 1938, 2001, 2007
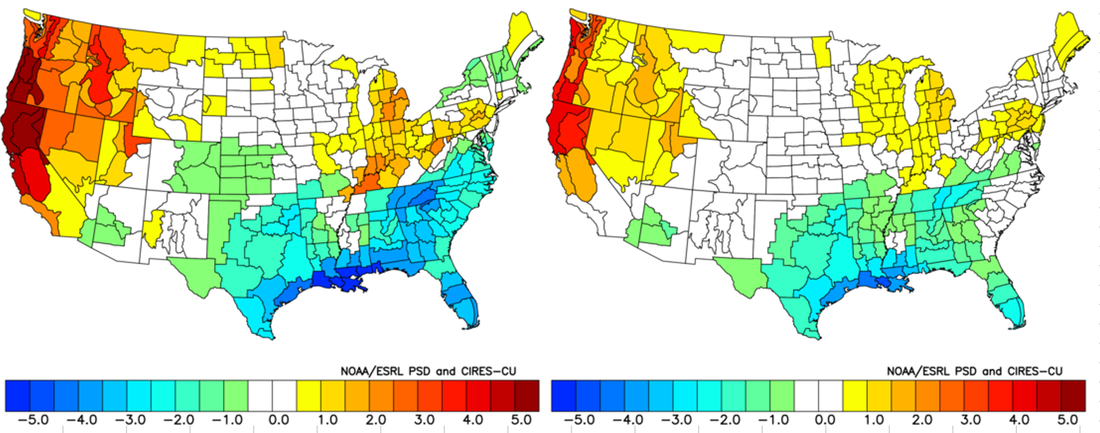
Temperature Anomalies from More Weighted PDO Analogs and Cherry-Picked PDO Analogs
SOI Analogs
- 1902, 1939, 1951, 1957, 1958, 1963, 2002, 2006, 2009
Temperature Anomalies from SOI Analogs
Precipitation Anomalies from SOI Analogs
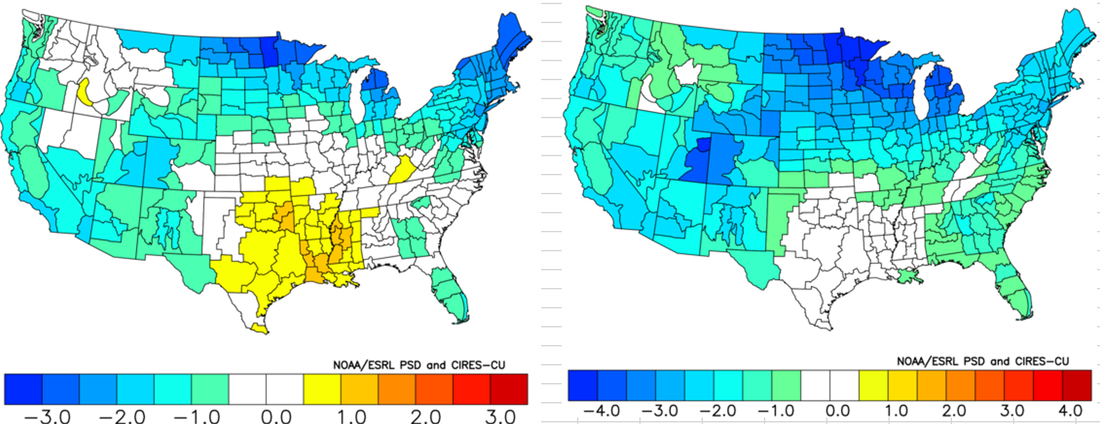
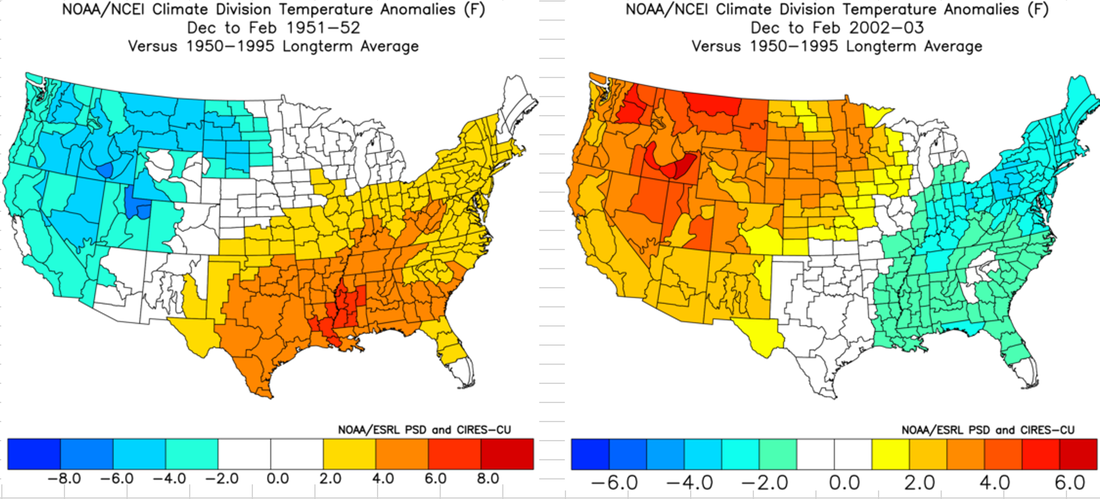
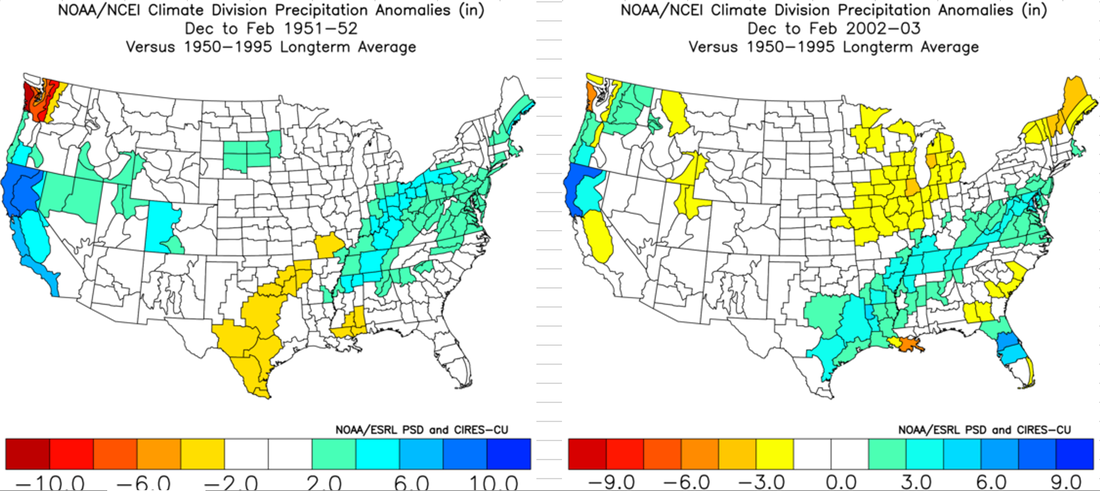
Issues With Some of the Best Analogs (Temp, Precip)
Strong Analogs With 2002 Weighted Heavier (Temp, Precip)
Conclusions
Limitations of analog forecasting: sometimes strong analogs produce opposite results, which skews the average and the range of the analogs. 1951-1952 and 2002-2003 are both strong analogs that show up in multiple analyses, but their temperature profiles for the winter are almost exactly opposite. The precipitation reanalyses, however, are very closely aligned. This is the pattern in all the analogs this year and is characteristic of a weak El Nino: The precipitation signal is stronger than the temperature signal. Confirming this is the scale of the analogs, which is auto-generated by NOAA ESRL PSD by the data that comes from each year, so a large swing in temperatures across the country during the period would result in a larger scale. The temperature scales are generally 2-6 degrees from 0 whereas the precipitation scales are 5-10 inches, which is a much larger departure from normal.
What We Know From the Analogs: stronger precipitation signal, weaker temperature signal. Reflected in the maps below are assessments of the analogs, the strength of the analogs, the type of analog, signal, strength, sea surface temperature analysis and adjustments.
What We Know From the Analogs: stronger precipitation signal, weaker temperature signal. Reflected in the maps below are assessments of the analogs, the strength of the analogs, the type of analog, signal, strength, sea surface temperature analysis and adjustments.
Preliminary Winter Temperature Forecast
Preliminary Winter Precipitation Forecast